2016 Mobile Index Analysis: iOS vs Android
The Liftoff 2016 Mobile App Engagement Index highlights data for the first half of 2016, with many trends back to 2015, from over 7.3 million app installs and 65 million post-install mobile events. The Index compares differences in app engagement by gender and post install events. We slice and dice data across five major app categories: Shopping, Finance, Gaming, Travel, and Utility.
In this post, we focus on the engagement by platform: iOS vs Android.
According to a 2016 Statista report, there are over 2.2 million Android apps and 2 million iOS apps. There is no indication on how many apps appear in both stores, but the overlap is likely high. When we look at acquisition costs associated with driving iOS and Android users to download these apps, there are considerable differences.
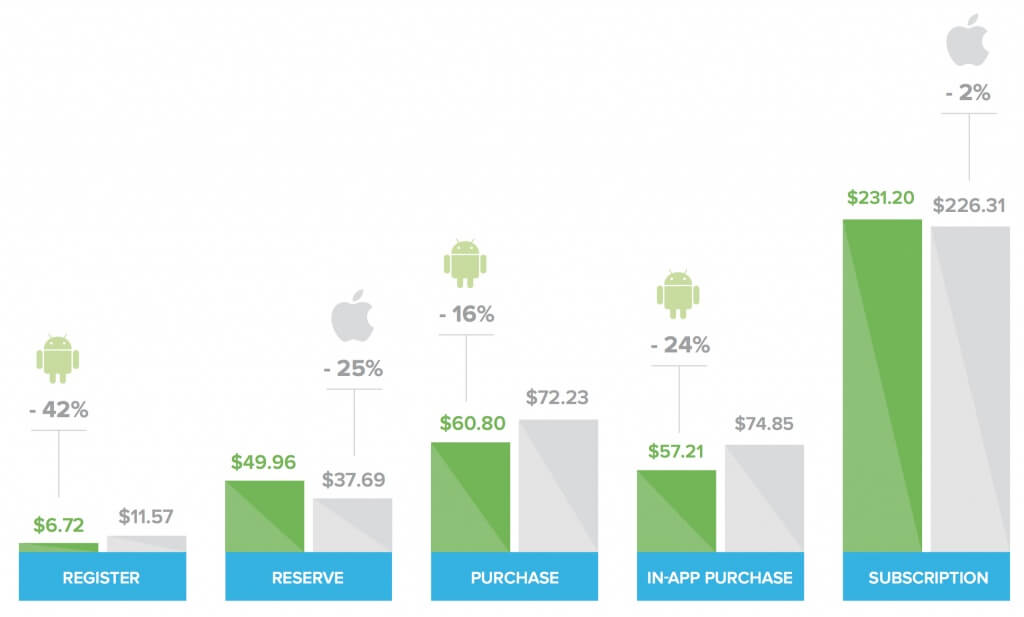
Ranking these acquisition cost differences by app category from high to low, we get:
- Register: -42% Android wins
- Reserve: -25% iOS wins
- In-app-purchase (gaming): -24% Android wins
- Purchase: -16% Android wins
- Subscription: -2% iOS wins
Without adding demographic layers of data to our analysis, there is no way to know for sure what exactly causes these differences. Demographic differences between those who use iOS vs Android are readily reported. A 2014 Forbes article outlined how iOS users are more educated and more affluent than Android users. iOS users were a “notch up the socio-economic scale: higher income, higher education, higher representation in professional and managerial jobs.” It’s likely this demographic data feeds in to acquisition cost differences we report on.
iOS clearly outperforms Android with regards to post-install engagement activity. Out of the five app categories analyzed, registration apps are the only one which Android performed better in, and with a slim margin:
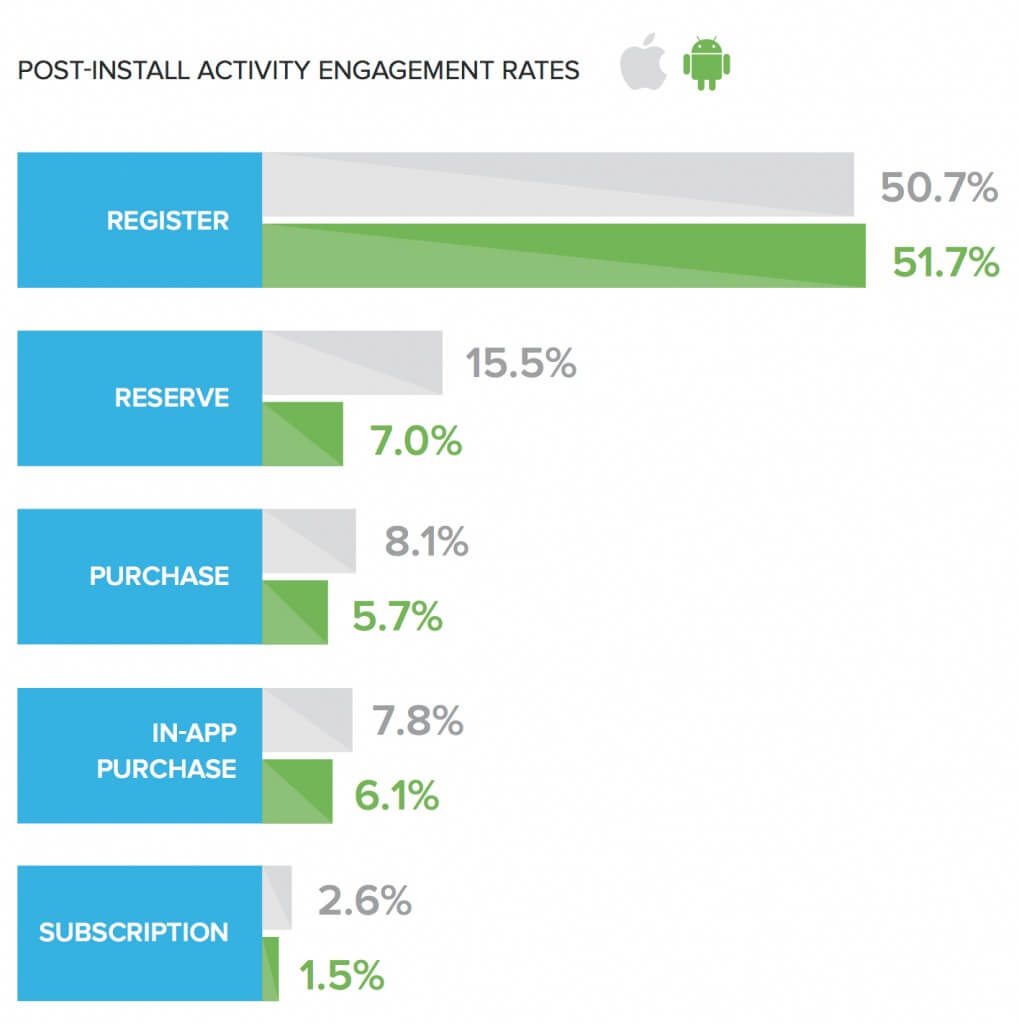
iOS especially outperformed Android in travel reservations. 15.5% of users who installed a reservation app on iOS went on to make a reservation, compared to 7% for Android users.
Download the entire Index to view complete stats on the information above, plus differences in gender and post install events. You will also learn insights across five major app categories.
![]()